This page is the top-level overview of a project where sound and music become a medium for data presentation. There are two other posts in the series:
- ECG Orchestration Gallery - where we present solutions to this problem provided by a couple of music producers.
- ECG Sonification Fail Gallery - where we store results that sound too horrifying for the main post.
And also a Colab Notebook with essential tools to recreate this work.
When visualisation is not enough
Sight is the go-to sense for identifying patterns around us, but there are structures that we can explore only in the form of an auditory experience - music being a prime example. In music, a ten-millisecond deviation can differentiate between a “great groove” and a “robotic performance,” but we have no well-established technique of exposing that visually or numerically1.
Similar issues arise whenever we work with “high-frequency time-series”2 data, with many events important to the analysis. In this post, I wanted to showcase an approach to the sonic exploration of patterns in those events using python and MIDI, with ECG data as a testing ground. Cardiac rhythm is one of the defining features of ECG3, and it has the advantage of being less complex than rhythm is in the case of music.
Without further ado, let’s start with an example. Please view the following animations with sound on 🔉
What in the world is this?
It’s a short fragment of ECG signal acquired from a patient suffering from a heart disease known as atrial fibrillation4. Rhythmic deviations are amongst the most significant diagnostic factors for identyfying that disease. To change raw signal into sound, I associated the moment of every heartbeat5 with a downbeat of a piano sequence6. The final effect sounds weird, but that weirdness is coming from the abnormal pattern of heart contractions - the rhythm you hear (or lack thereof) is what we can call a “sonification” of the data you see and corresponds to this particular cardiovascular problem.
Why would you do that …
Whenever you’re trying to learn something complicated, be it playing an instrument or writing software, you often practice tasks that are only partially related to what you are learning. Playing scales is not the same as playing music, and solving leet code challenges is not the same as building software. For me, sonification also occupies that space - it is not very useful for analysis, nor is it helpful in listening or creating music, but it can help exercise the skills required for analytical research and musicality7.
… with electrocardiograms?
ECG data is rich in information and quite challenging to analyze algorithmically. It is common for ECG signals to be heavily noise-polluted8, with a very uneven distribution of events and with significant variations between patients9. It’s also pretty tough to display effectively - you would need to see 16,000 samples like in the clip to see the entire signal. That’s only 18 hours in this case, while longer ECG exams can go for more than 14 days - all that to catch a glimpse of a single event that can last less than 5 seconds and could be pivotal for the prescribed treatment.
It is rather unlikely that sonification will solve any of those issues. Still, it’s a great way to explore the data and inspire ideas for ECG analysis and algorithmic music generation.
Heart rhythm
On average, the adult human heart will beat close to 90 thousand times per day. Each beat consists of a series of contractions and expansions10, coordinated to pull and push blood through the body. The nervous system manages those movements with a series of electrical signals that we can pick up just by sticking some cables strategically onto the skin around the chest. By looking at that activity recorded on an electrocardiogram, we can say when the movements are happening and what electrical process triggered them. If everything is healthy and standard, all beats look similar and occur in a regular sequence.
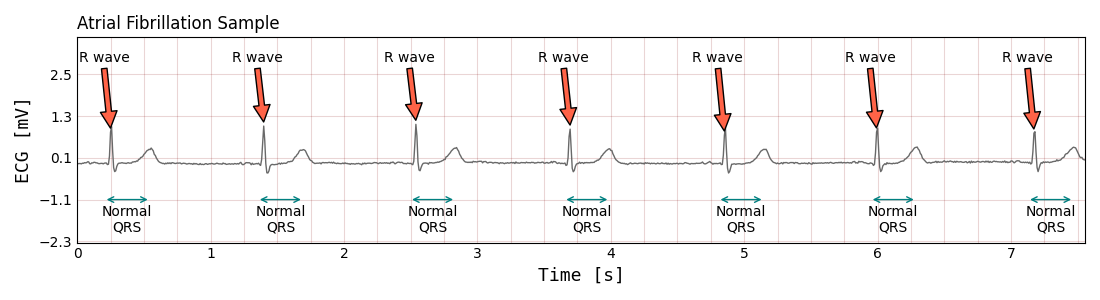
It’s not uncommon for the heart to deviate from the metronomic pattern and even use different electrical instructions to move the heart muscles (which we can see as a different shape of the QRS5). The line where those deviations become a problem and an indicator of a health-threatening disease is statistical: the long-term frequency of occurrences is crucial to make a well-informed decision.
Here’s a close up of such aberrations:
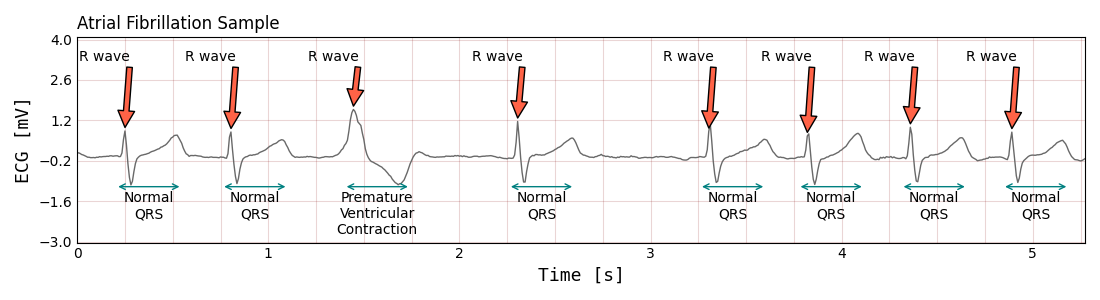
If more than 10% of the signal resembles this sample, it’s most certainly a kind of arrhythmia, and a cardiology consultation is in order.
Atrial Fibrillation Database
In this venture, I’m using data available in the Long Term AF Database. Atrial fibrillation is a heart condition that causes an irregular heart rate, so it should provide a broad spectrum of rhythms for sonification experiments. The database contains ECG recordings of 84 patients. The data is split into two objects for each patient: raw ECG signal and a set of annotations. There are approximately 100,000 labels for every 24 hours of the signal. Most of the annotations are labels assigned to each separate heartbeat (QRS). There are also annotations marking longer sections of the signal, where the information about the type of rhythm is available.
It’s standard for the annotations not to be balanced. Usually, over 90% of beats are normal (N class),
and the rest of the labels is distributed between abnormal beats called “atrial premature beat” (A class) and
“premature ventricular contraction” (V class)11.
Each beat annotation refers to a single timestamp, selected to be the position of the beat’s R
wave - usually the most prominent peak.
The labels marked as + and " refer to rhythm annotations - sequences of beats rather than a single QRS.
Here’s what the first five rows of the annotations table can look like:
+--------+---------+
|   time |  symbol |
+--------+---------|
|  0.25  | N       |
|  0.775 | N       |
|  1.415 | V       |
|  2.11  | N       |
|  2.8   | N       |
|  ...   | ...     |
+--------+---------+
This table describes a series of events occurring in sub-second intervals - that sequence will be at the heart of the following experiments - timestamps of the human pulse will become timestamps of the musical rhythm 🥁 🥁 🥁
MIDI and Music Notation
MIDI is a 40 years old abstraction layer for communication and interfacing with electronic musical instruments. It’s a powerful standard, but we’re just going to scratch the surface and use it to interact with a basic, virtual piano. Each note on that piano12 has a number assigned, and you can trigger every sound just by joining its number with information about volume, start time, and end time (i.e., duration).
It’s intuitive to think about a set of notes as a table13, where each note is a separate row. Here’s such a table with a major seventh chord. Looking at the timestamps, we can see that it is played legato (no silence between sounds) with a quarter of a second per note, and a slight crescendo (i.e., note velocity is rising - sounds are getting louder):
Ebmaj7
+---------+---------+--------------+------------+------------+
|   pitch | sound   |   start_time |   end_time |   velocity |
+---------+---------+--------------+------------+------------|
|      51 | E♭      |         0    |       0.25 |         90 |
|      55 | G       |         0.25 |       0.5  |         97 |
|      58 | B       |         0.5  |       0.75 |        104 |
|      62 | D       |         0.75 |       1    |        111 |
+---------+---------+--------------+------------+------------+
Aesthetic decisions
The time column in the annotations table will be repurposed as the start_time column for the
downbeat notes of the upcoming sonifications. Duration, pitch, velocity, and optionally any notes in between
can be considered as aesthetic choices.
It’s not often discussed as an essential part of data science, but whenever the dataset you are working with is sufficiently complex, you start facing choices about how to present it in a way that’s clear and easy to understand. You can outsource a lot of those decisions for basic charts and visualizations by choosing an existing framework, like matplotlib or plotly. But in the case of sonifications, we are left to our own devices: instrumentation, harmonic relations, tempo, articulation, and dynamics are all necessary parts for any sound aspiring to be musical. As with any other kind of design, there are infinite possibilities. Here, I’m limiting myself to just a piano and rudimentary elements of western music theory, like scales, chords, and intervals.
To make it more concrete, let’s go over a couple of basic examples.
Sonifications
1. Normal heart rate with a chromatic scale:
- healthy heart
- assign a piano note to each heart beat, starting at the R-wave
- notes go up over a chromatic scale; in MIDI, pitch values are :
[60, 61, 62, ...] - play at X2 speed of the recorded heart rate
2. Atrial Fibrillation episode with a harmonic minor scale:
- atrial fibrillation episode
- notes go up over a harmonic minor scale; in MIDI pitch values are:
[60, 62, 63, 65, ...] - X1.7 speed of the recorder heart rate
3. Atrial Bigeminy episode with a minor pentatonic scale:
- atrial bigeminy episode
- X2 speed of the recorder heart rate
- C minor pentatonic scale
Code Golfing for Compositions
Finding ways to populate the MIDI track with specific arrangements is reminiscent of various coding exercises or whiteboard recruitment tasks used to assess a candidate’s versatility. Can you write a FizzBuzz14, but instead of printing every 3 or 5, play a dominant seventh flat five chord? Dealing with harmonic relations is even a more substantial challenge than monitoring divisibility. Here’s an example of what the solution could look like:
Artistic Utilization
Coming up with algorithms to populate the rhythm can be fun if you like this kind of thing. But you can also take a not-programmatic approach and put the notes in manually. So I asked a couple of independent music producers to compose short pieces of music following the rhythm of patients with atrial fibrillation; you can see and listen to the results here.
During research for this post, I explored a whole plethora of algorithmic approaches. Only a couple of examples made it here, and I did try to keep them conservative in sound and tone. If you’d like to hear some more daring productions, we keep them in a separate post here.
Links & Sponsors
If you’d like to run some experiments in this area, check out this Colab Notebook as a starting point. I’m on twitter if you have questions and on linkedin if you’d like to connect.
This work wouldn’t be possible without the support of Filestack - if you’re in need of file uploading APIs with lots of fantastic options head over to the documentation and start implementing 🔨
👋
-
If we were able to asses the quality of a groove, it would be possible to generate one with desired qualities - instead we are stuck in the world of rhythmic grid quantization - check out what Rick Beato has to say about it. ↩︎
-
“High frequency” is not a very precise description. Once a year can be “high” when you are working with geological time scales. In the end it just means that there’s a lot of data. ↩︎
-
Heartbeat is a cyclical process with non-trivial physiology. Observing heart rhythm is the easiest, non-invasive method of monitoring that physiology. ↩︎
-
This is a serious condition, and developing methods of assessing risks alogirthmically is an ongoing challenge. ↩︎
-
Signal of one heartbeat consists of multiple waves called ‘p’, ‘q’, ‘r’, ‘s’, and ‘t’. In short the full beat is often called a QRS /cue-ar-ess/. One cycle for all those waves can last half a second, in order to localize this event in time a timestamp is assigned to the peak of the R wave. Read more. ↩︎
-
The sequence is the famous 4 chord progression, starting on A minor. ↩︎
-
Here are some other sonifications: three body problem, double pendulum, and sorting algorithms. ↩︎
-
One major source of noise is the electrical activity produced by skeletal muscles. Using wired headphones is another. ↩︎
-
Most bizare edge case I heard about is a patient with two hearts. ↩︎
-
During the systole the blood is squeezed out, and during the diastole it’s being sucked into the heart. ↩︎
-
Here’s a full list of annotations that you can find in those datases. ↩︎
-
Assigning numbers to piano keys is a popular way to think about it, middle C is always
60. ↩︎ -
Unfortunately there’s a major tradeoff - any information about harmonic relations gets lost during the transcription to MIDI. This makes it a poor candidate for a in-code data modelling when working with musical structures, ↩︎
-
FizzBuzz is a counting game that used to be popular programming recruitment question. ↩︎