This blog post demonstrates one of my favorite mind-blowing physics facts: the sunlight is much older than you think. To explain this, I will show how to develop a numerical simulation of radiative energy transport (i.e., the light going out) in stars based on a brutally simplified model of photons (light particles) performing a random walk to the surface of the sun. It is supposed to be an introduction and a tutorial for both physics and python, so I hope anyone can learn more about how the stars shine.
But first, let’s take a physicist’s look at energy and energy transfer in a more extensive context1.
Energy conservation ⚖
The law of energy conservation - which states that energy cannot be created nor destroyed but only moved around - can be used to find a source of any movement or action in some previous processes that provided energy to whatever we’re focusing on. For example, your car can drive fast because it burns fuel - by itself hardly a newsworthy revelation - but if you apply that investigative procedure recursively, it can get interesting. Burning fossil fuels releases energy2 stored in its molecules - that energy originates in plants blooming on Earth millions of years ago3. Those plants stored it because being a plant requires using energy from the sun to perform various chemical transformations that accumulate the sunlight energy4 in its growing body. Sunlight is produced inside our star’s core5 - squeezed so hard by the gravitational pressure6 that it emits photons while violating the periodic table of elements and changing hydrogen into carbon, oxygen, and some other stuff in a feat of true, nuclear alchemy. Explaining where the energy in gravitational pressure inside a star comes from is a little more tricky7, but long story short: it was released8 during the Big Bang. The energy of the Big Bang comes from … the explanation is quite simple and elegant; sadly, this paragraph is too narrow to contain it9.
So there you have it; next time someone asks if you drive gas or electric, you can say that your car is powered by the creation of the Universe itself. And don’t let the tasteless jokes distract you - question about the initial origin of energy in our Universe is one of those we expect to answer with physics, but so far, it’s an absolute mystery10.
Let the light out
What I wanted to focus on is just two steps away from that fundamental mystery - always a good sign for a physics project - it’s about the energy transfer from the sun’s center to the surface of our planet. We can describe this process as having two separate steps:
- Photons are created inside the core and travel to the surface of the star.
- Photons are released from the sun’s surface and travel to earth.
The distance between the earth and the sun is ~8 light minutes, so obviously, step 2 takes ~8 clock minutes, and each photon travels over 150 million kilometers11 before scattering in our atmosphere. In step 1, after coming into existence, it only has to cross 0.7 million kilometers12, a meager 1/300th of the step 2 distance, but it can take each of the photons hundreds of thousands of human years to reach the surface of the sun.
The light inside a star seems to be nine orders of magnitude slower - this is a very surprising result13 - it is less than a meter per second, very close to the velocity of a walking tortoise! A simple explanation for that delay is based on the premise that every electron14 inside acts like a pinball bumper, scattering every photon interacting with it. This scattering changes the direction of movement of photons and causes them to wander inside the star, going from electron to electron, only by luck finding freedom at the surface.
We are going to assume that this explanation is correct15 and try to understand the underlying dynamics. You have to keep in mind that initially, models like that were introduced to explain some empirical puzzles, like why is the sun radiating a “black body”16 distribution while nuclear processes at its core can only produce a high energy gamma-ray photons? Only in hindsight do we know that the “random walk” explanation is correct, but a hundred years ago, it might have been anything, like an unknown exotic element within the sun’s interior, a new force of nature, or alien technology.
Stochastic modeling
Imagine for a moment that you don’t know anything about statistical analysis, calculus, or algebra, and you are not sure
if stochastic is even a word. Still, you like python, and you know how to simulate a fair (equiprobable) coin flip17.
That’s enough to build a proper numerical simulation of light finding its way to the surface of the sun - and that’s what we are going to do.
To simplify the problem, let’s begin with a numerical toy model with the following properties:
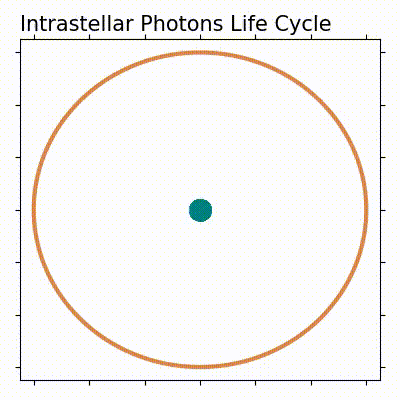
- One dimension - instead of a 3D ball or 2D circle, the star will be represented by a line segment with the photon emitting core at the center.
- Width 20 (arbitrary units) - in 1D, width is the same as diameter in 2D or 3D.
- Homogeneous matter distribution, with density 1 (i.e., one electron at every unit of distance).
- 50% chance that a photon is reflected when encountering an electron.
- An arbitrary unit of time will be called a “step,” so the speed of light can be equal to “1 distance unit per 1 step”.
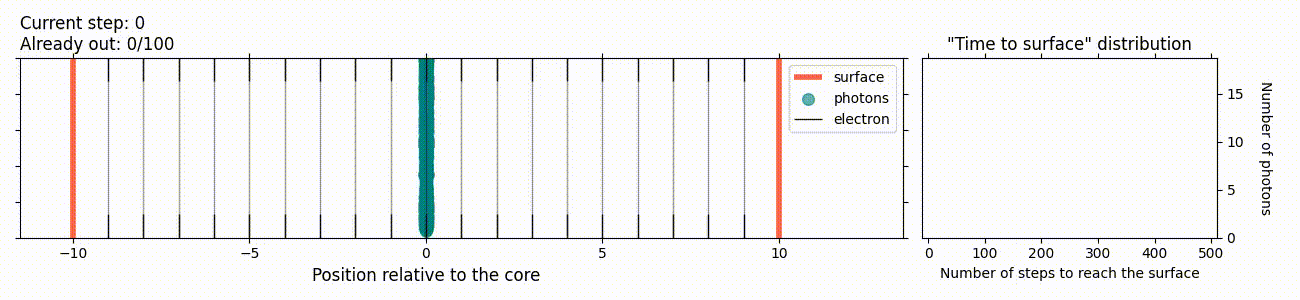
In a diagram form and in “slow-motion,” this model will look like that:
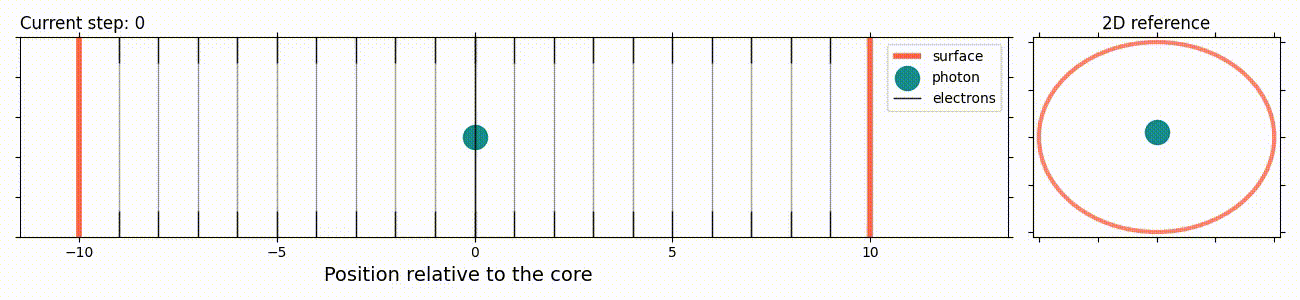
There’s already a single photon on that diagram. It is wandering randomly from point to point (from electron to electron), trying to get to the surface and start its flight to our planet18. There’s also a two-dimensional reference to clarify how this simple model is relates to real, circular stars.
Here’s the code that generated data for this simulation:
import numpy as np

def random_step(current_position):
    # In 1 dimension we can only go left or right - that's the coin flip
    position_change = np.random.choice([-1, +1])
    next_position = current_position + position_change
    return next_position

# Define the arbitrary properties of the system
radius = 10  # Half of the diameter
current_x = 0
number_of_steps = 30

# Random walk is a series of positions reached by taking steps in random directions
random_walk = [current_x]
for step in range(number_of_steps):
    current_x = random_step(current_x)
    random_walk.append(current_x)
This “for loop” is a minimalistic implementation of a random walk. Yet, it is more than enough to build intuition about the problem and explore the statistical properties of this process.
Sunshine in silico
To answer the question “how old is the photon when it gets out of a star” we need to figure out the relation between the radius of that star, the number of electrons inside19, and the number of bounces that the photon does before reaching the surface. Let’s call this value “time to surface” or TTS for short - that value is synonymous with photon’s age.
For the model I described, this could be calculated on paper quickly, but instead, we can try to get the answer by running the simulation multiple times and waiting for the photon to get out. That way, we are collecting data about a population of photons, and for each of them, we can “measure” (in the Monte Carlo sense) the number of steps taken before getting to the surface (TTS).
def get_random_walk_to_surface(radius):
current_x = 0
random_walk = [current_x]
while abs(current_x) < radius:
current_x = random_step(current_x)
random_walk.append(current_x)
return random_walk
radius = 10
random_walks = []
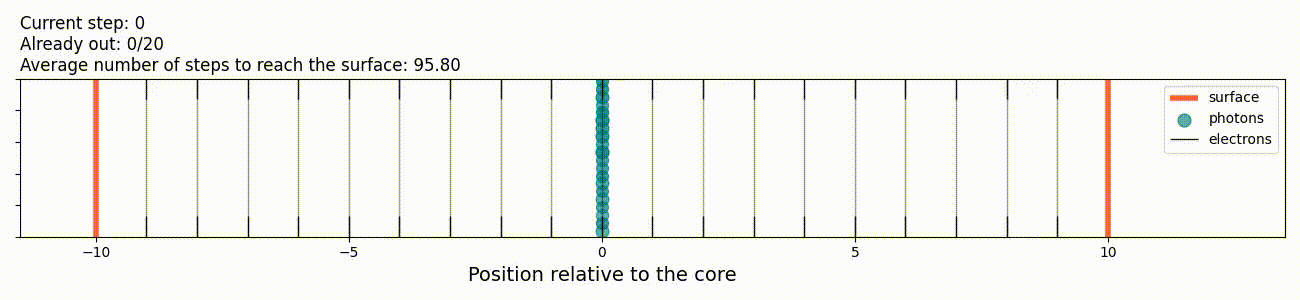
number_of_photons = 20
for photon_id in range(number_of_photons):
random_walk = get_random_walk_to_surface(radius=radius)
random_walks.append(random_walk)
average_tts = np.mean(len(random_walk) for random_walk in random_walks)
print('Average number of steps to reach the surface [TTS]:', average_tts)
Average number of steps to reach the surface [TTS]: 77.30
Here you can see 20 independent photons scattering on the electrons in random directions. One thing to notice is that the first photon escapes after little more than 20 steps, while the last one takes over 200 to get out. This variation already gives us a valuable insight: the light emitted by stars was not “born” at a single, precise moment, but it’s more like a multi-generational family of particles, spanning thousands of years in age.
Of course, 20 is not a very large number, and our computers are capable much, much more. The only issue is that the visualization gets hard to comprehend as the number of photons grows. We can try one more, this time with 100 particles - but it’s a perfect moment to start paying attention to the statistical distribution instead of the individual trajectories: the bar chart on the right shows how many photons escaped for a given number of steps. And its readability should stay the same no matter how high we turn up the number of objects in the simulation.
It’s even easier to see how stretched out in time is the age of light when leaving the star. We have to remember
that, but to make the notation simple, we can use the average number of steps as a single-number description of
that distribution, ignoring its width and shape. In that case, we would say that light has an average age of 102.72
“steps” when it starts shining.
Finding the law
The model we are using has two parameters that we could manipulate: size and density. Right now, the size is 20 and density is 1 - these units are arbitrary, but at any point, we could switch to the real-world values: both radius and density of the sun are known, and we could use those to perform the simulation. That’s not a particularly good plan because the sun is so big, and each photon has so many interactions that the calculations would require almost infinite computing power and eons of runtime for a realistic model. Instead, we can try to look for patterns - how is the “average age” changing when we go through multiple values of size and density parameters? Is there some hidden set of rules that governs those changes? Can we find a way to describe those rules? Let’s see what we get after running multiple simulations for a bunch of different radius values.
# Run the simulation for each radius
radii = [16, 32, 64, 128]

results = []
for radius in radii:
    age_distribution = get_age_distribution(radius)
    result = {
        'distribution': age_distribution,
        'radius': radius,
    }
    results.append(result)
On the left, we have the distribution of the “time to surface” measurement and on the right is a graph showing how that value changes for different sizes.
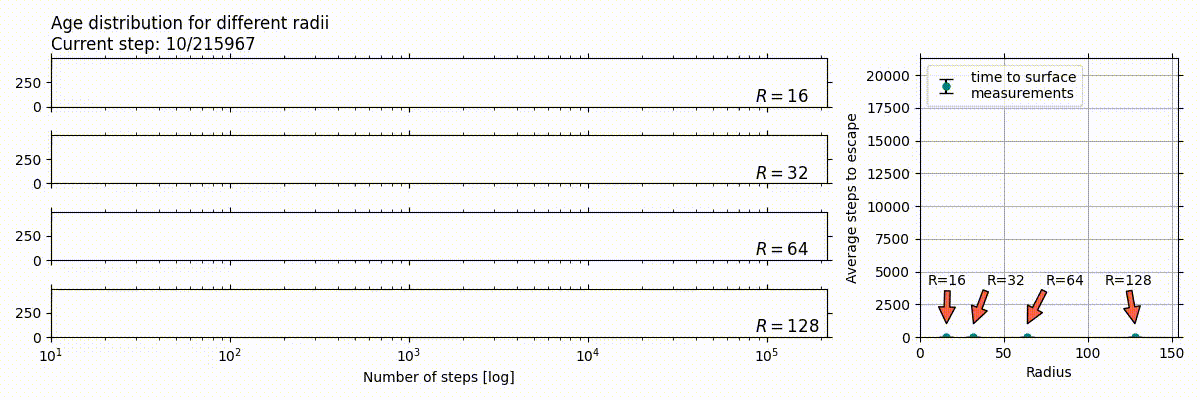
We are looking for a relation between radius and “time to surface,” and all we have here are the four measurement points shown in the right-side graph. If we look at the same chart, but with 20 measurements instead, a clear pattern emerges.
measurements = []
radii = [10 + it * 10 for it in range(20)]
for radius in radii:

    # For each radius let's have 100 simulations
    per_radius_results = []
    for it in range(100):
        random_walk = get_random_walk_to_surface(radius=radius)
        # Number of steps to reach the surface
        measurement = len(random_walk)
        per_radius_results.append(measurement)

    # Use `np.std` for measurement error
    measurement = np.mean(per_radius_results)
    measurements.append(measurement)
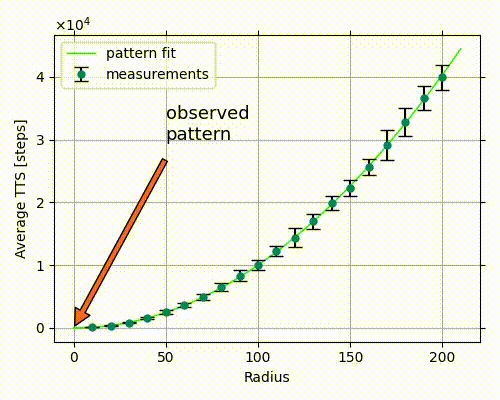
Let’s use numpy to fit a polynomial:
# It's resonable to start with the lowest possible polynomial degree
polynomial_coefficients = np.polyfit(radii, measurements, deg=2)

print(polynomial_coefficients.round(2))
[  1.0041813    0.22511341 -16.01989298]
This yields a parabola equation:
$$ \text{time to surface} = 1.004 \cdot \text{radius}^2 + 0.225 \cdot \text{radius} - 16.02 \tag{1} $$
Simulation vs. Reality
Equation 1 is a poor man’s law of physics, but we can try to confront reality using it. First of all, let’s
think about an intuitive way to interpret the variables it contains. “Time to surface” is defined as a number
of “steps” a photon takes - with a critical assumption that each step is of the same length, both in space
and in time, and that the photon covers that distance undisturbed with the speed of light. That distance, called
mean free path20, can be estimated for real stars - all we need to know is density21 and the probability of a photon
being scattered. You can find multiple methods of calculating this parameter22, each with a different final value.
For this estimation, we’ll use first of the referenced sources where mean free path = 2 cm - which corresponds
to step travel time of 6.6 * 10-11
s.
On the right-hand side, there is only “radius,” also defined in steps. I hope it’s not confusing that both time and
distance are expressed with seemingly the same unit - TTS is the time it takes to cover N-steps, while the radius
is the distance equal to the spread of N steps. Since every step is 2 cm and we know the sun’s radius to
be 700,000 km, the radius in equation 1 is equal: 3.5 * 1010
- after squaring, we get 1.2 * 1021
. Divide by the
step travel time and voilà - we get 8 * 108
seconds - roughly 2,500 years.
Epilogue
Although it can help us understand what it’s like to be among the unreleased photons inside the sun, this model is dramatically simplistic and would require significant effort to take it to another level of scientific rigor. Here is a list of issues one would need to address to bring this model closer to the real world:
- Not enough spatial dimensions - the stars we see in the skies seem to be consistently 3-dimensional, and it seems pretty likely that equation 1 will change for a model with more dimensions. Alternatively, to prove otherwise would require a separate effort.
- Lack of analytical derivation of equation 1 - I just assumed it would be a second-degree polynomial. It could have been any function, and the difference may inflict significant error on the extrapolations we might want to do.
- Stellar interior - I assumed a constant matter density and distribution, which is not the case in real stars. In a more realistic simulation, we could add density distribution depending on the distance from the core - this would also affect the “mean free path” approximation method.
- No frequency consideration - light with different wavelengths has different properties that influence the number of bounces and “time to surface” alike.
I hope that this can help you develop some insight into the fantastic bure-force scientific approach that is Monte Carlo. For me, it’s one of the great examples of spectacular insights that humans were able to produce with a concentrated effort of multiple generations of scientists and engineers that make it now possible to simulate stars on a 2010 laptop.
If you have any questions or comments just reach out on twitter.
-
Energy is a broad term with a lot of meanings outside of physics. If you are not sure what it is inside of physics, take a glance at its Wikipedia entry. ↩︎
-
Learn more about the combustion process. ↩︎
-
Learn more about aquatic phytoplankton and its transformation into oil. ↩︎
-
You probably don’t need to learn more about photosynthesis. ↩︎
-
Wikipedia has excellent pictures on this. If you want to go deeper, check out the Noble Lecture of H.A. Bethe, who figured this part out. ↩︎
-
Gravitational collapse is a remarkable phenomenon, especially if you consider that it’s happening in cycles - as if the Universe is taking slow breaths: matter comes in, stars are created, shine, and explode - new matter comes out. Roughly five to ten billion years, then repeat. The sun is a part of the second cycle. ↩︎
-
The cloud of space dust that collapsed into a star already had the energy required stored in the form of gravitational potential energy. Just like a water dam stores energy by keeping water high above the ground, the cloud of space dust has energy stored by being far from its center of gravity. ↩︎
-
It’s not super evident if there is any energy at all when considering everything we know of - check out zero-energy Universe and positive energy theorem. ↩︎
-
No one likes to explain jokes, but this is a reference to Fermat’s last theorem. ↩︎
-
It’s just a variation of the “how was the universe created” question. ↩︎
-
The radius of the sun is ~0.7 million kilometers or ~0.4 million miles. ↩︎
-
To explain that level of velocity change, the refractive index of the sun would need to be close to 109 , but we know that for plasma (dominant state of matter inside stars), it’s close to 1. ↩︎
-
There is also roughly the same number of protons inside, so the sun is electrically neutral. Still, the probability that a photon will get scattered by a proton is 108 times lower. ↩︎
-
Its correctness is very limited, but it is perfect for educational purposes. ↩︎
-
That name can be confusing, there’s nothing “black” about the sun, but this terminology allows us to define a single number that describes its temperature: 5800K. ↩︎
-
Here it is:
flip_result = np.random.choice(['heads', 'tails'])now you know for sure. ↩︎ -
Most likely, it will reach nothing but the empty void of space. Only 4 * 10-10 of light emitted by the sun gets here. ↩︎
-
That information is equivalent to the star’s density and the average distance between electrons inside. ↩︎
-
It’s a generic term, not specific to stellar physics. ↩︎
-
Density = Volume / Mass. Both volume and mass are fairly easy to measure. To know the volume, all you need is the radius. To know the mass of the sun … you have to weigh it. ↩︎