You can recreate every animation presented below with these Colab notebooks.
Time Series Animation
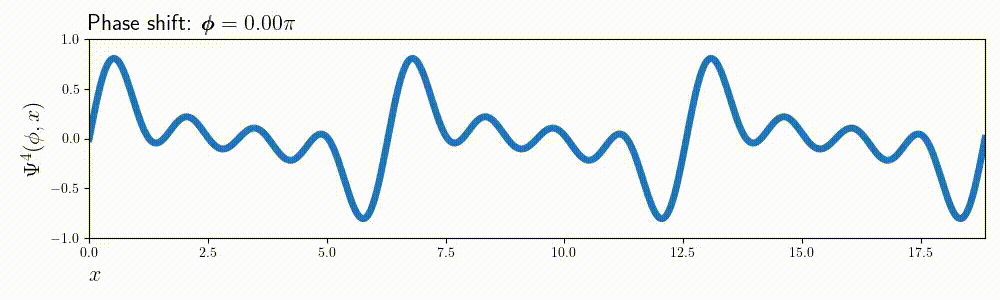
Let’s define a simple, but composite function, that is easy to write down and can produce entertaining, wavy movement:
$$ \Psi^m(x, \phi) = \frac{1}{m} \sum_{n=1}^{m} \cos(n\cdot\phi) \cdot \sin(n\cdot x + \phi) $$
It’s just a bunch of sines and cosines combined together to make a squiglly wave. Setting the \( \pmb{\phi} \) parameter as a variable of time (\(\pmb{\phi}(t) = t\)), we can create a very lively animation:
In python, a function like \( \Psi^m(x, \phi) \) is not much more than a for loop:
import numpy as np

def psi(x: np.array, phi: float, m: int = 4) -> np.array:
    frequencies = range(1, m + 1)
    signals = []
    for frequency in frequencies:
        amp = np.cos(phi * frequency)
        signal = amp * np.sin(x * frequency)
        signals.append(signal)

    psi_values = np.sum(signals, axis=0) / m
    return psi_values
In order to render it into an animation, we need to define the space of arguments \( x \isin [0, 6\pi] \), and the values of \( \pmb{\phi} \isin [0, 2\pi)\) that the animation will go through. Variable \( \pmb{\phi} \) corresponds to the phase shift of the waves, hence its name.
# Define the `psi` function degree `m` ...
m = 4
# ... and the domain x ...
x = np.linspace(0, np.pi * 6, 1000)
# ... and the phi values the animation will go through
phase_shifts = np.linspace(0, np.pi * 2, number_of_frames, endpoint=False)
With that prepraration we can generate separate matplotlib chart for each \( \pmb{\phi} \) value and save it to disk.
# Open the matplotlib figure
fig, ax = plt.subplots(figsize=[8, 2])

# Define storage location for the frames
frame_storage_path = 'tmp/frames/{}.png'
for frame_id, phi in enumerate(phase_shifts):
    # Prepare the data and plot
    signal = psi(x=x, phi=phi, m=m)
    ax.plot(x, signal, lw=5)

    # Pad the name with 0s so alphabetical and numerical orders are the same
    file_name = f'{frame_id:05}'
    file_path = frame_storage_path.format(file_name)

    # Write the current frame to disk
    fig.savefig(file_path)

    # Remove everything from the figure
    ax.clear()
A crucial piece of the puzzle here is changing a bunch of image files
into an animation. There’s a myriad of ways to do it - the one I’m advocating for
is with ffmpeg.
Here is a wrapped command to change a folder of sorted .png files into a video:
import subprocess
from pathlib import Path

def ffmpeg_movie(movie_dir: Path, framerate: int = 30) -> None:
    image_pattern = movie_dir / '*png'
    savepath = movie_dir.with_suffix('.mp4')

    # It's a lengthy command, but there's no need to grok it
    command = f"""
        ffmpeg -y -framerate {framerate} -f image2 -pattern_type glob \
        -i '{image_pattern}' -c:v libx264 -r 30 -profile:v high -crf 20 \
        -pix_fmt yuv420p {savepath}
    """
    subprocess.call(command, shell=True)
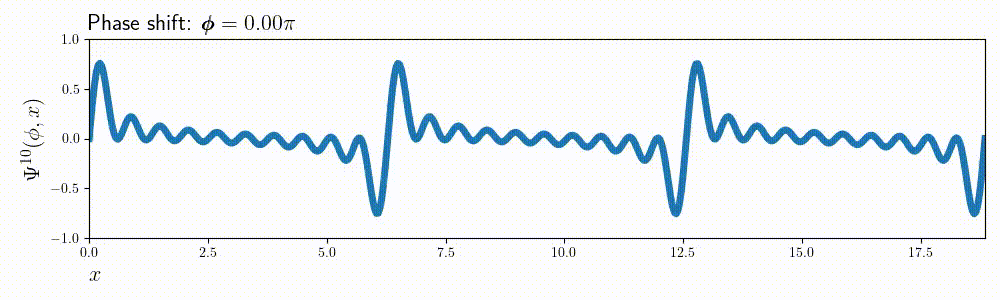
This whole procedure can be easily adjusted for the values of \( m\) or \(x \). For example here’s the same animation for \( m = 10\):
Composite charts
This approach scales up well, and we can show more information on a single animated figure just by using a grid of subplots:
# A figure with 4 separate plots
figure, axes = plt.subplots(nrows=4, ncols=1)
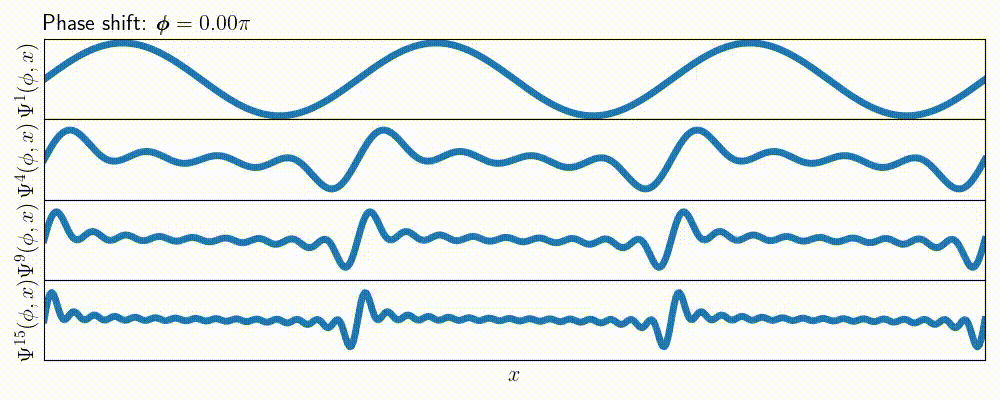
def draw_psi_m(ax: plt.Axes, phi: float, m: int) -> None:
    """ Code to draw a single frame of animation """

m_values = [1, 4, 9, 15]
for phi in phase_shifts:
    for ax, m in zip(axes, m_values):
        draw_psi_m(ax, phi, m)
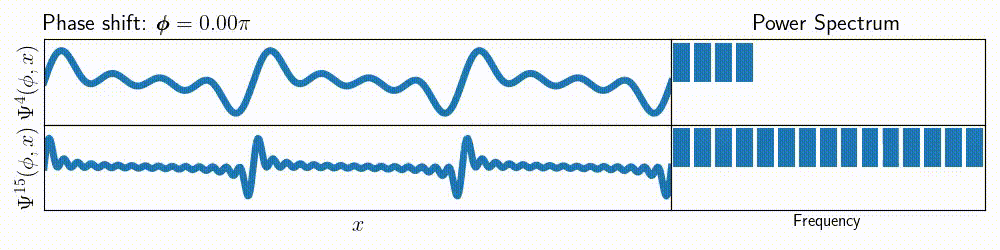
With the subplots approach you can easily extend the amount of visible data.
For example, here’s a figure showing not only the \( \Psi^m \), but also
the frequency spectrum of that function (note that each of the sines inside \( \Psi^m \) has amplitude
defined as \( \cos(n\cdot\phi) \), where \( n \in [1, m]\)).
Animate everything
The word ‘animation’ comes from Latin animātiōn: “a bestowing of life”. Whatever the problem you are working with, if only you can plot it with matplotlib, I highly encourage you to find a way to “bestow life” in your work by making an animation. Of course, finding a way to represent your system as a function of time can be tricky (and may not always be a good idea).
To make it easier, here are some examples that I wanted to share together with code on Google Colab to create them.
Double Pendulum
This is a common occurence on this blog. There are many reasons to be in awe of the double pendulum - from it’s minimalistic simplicity to infinite complexity of trajectories it can follow. Watching it dance is both hypnotic and meditative - if you are a fan of that kind of entertainment go check out the gallery of periodic solutions.
Here this is a pendulum with a bar plot showing division of mechanical energy between the potential and kinetic variety:

Here’s a notebook to generate double pendulum animations of this sort.
Quantum Computing in 3D
Solving the Schrödinger equation in a spherically symmetric potential is a rite of passage for physics students. And at the end of that journey a glorious set of functions makes an appearance: Spherical Harmonics. In my opinion the importance of the Schrödinger equation cannot be overstated: it’s the best description for the atom we have and the shapes of its solutions should be introduced as early as the periodic table of elements.
In case of quantum mechanics, spherical harmonics represent the wave function of the electron. This means that to get the spatial distribution of probability for the measurement of an electron you need to take the square modulus. That is the source of a lot of weirdness associated with quantum mechanics: on this animation you can observe that the simple addition of two different states produces a result that’s far away from the initial states (pay attention to the moment in the middle of the transition, when the combination is equal to: \(\frac{1}{2} Y^2_2(\theta, \phi) + \frac{1}{2} Y^2_0(\theta, \phi) \) - it’s a completely new shape!):

This kind of addition is also a rare occurance of quantum computing actually working 😅. Here is the notebook for making animations like that.
That’s it! Here are some socials to connect: